SlideShare a Scribd company logo
© 2023 Cathrine Wilhelmsen (hi@cathrinew.net)
Website Analytics in My Pocket
Using Microsoft Fabric
Cathrine Wilhelmsen
October 10th, 2023
© 2023 Cathrine Wilhelmsen (hi@cathrinew.net)
Session Description
As a technical blogger and event organizer, I'm always curious about my website traffic.
How many visitors have I had? Where are they from? What days and times are my
websites most popular? Which posts are read the most?
All this information is available to me. There's only one gotcha: the data is only available
for the past 30 days. That means if I want to compare how my website is doing next
year compared to this year, I need to save the data somewhere else so it doesn't get
lost - and build my own visualizations on top of it. Luckily for me, that's what I do for a
living!
In this session, I will show you how I've used Microsoft Fabric (the newest analytical
service from Microsoft) to create my own pocket-sized dashboard for my website
analytics. First, I will explain how I automatically collect the data from an API and store
it in a central location. Then, I will show how I visualize the data in a mobile-friendly way
using Power BI.
© 2023 Cathrine Wilhelmsen (hi@cathrinew.net)
@cathrinew
cathrinew.net
© 2023 Cathrine Wilhelmsen (hi@cathrinew.net)
Data
Factory
Data
Engineering
Data
Warehouse
Data
Science
Real-Time
Analytics
Power
BI
Data
Activator
Unified Data Foundation with OneLake
Data Governance with Microsoft Purview
© 2023 Cathrine Wilhelmsen (hi@cathrinew.net)
What did I build?
Cloudflare
API
Microsoft Fabric
Daily Stats
Hourly Stats
Website Analytics
© 2023 Cathrine Wilhelmsen (hi@cathrinew.net)
Why did I build it?
Wanted to phase out Google Analytics
Cloudflare offers free, privacy-first analytics
Moved to Cloudflare in September 2023
Cloudflare only stores data for 30 days
© 2023 Cathrine Wilhelmsen (hi@cathrinew.net)
Why did I build it this way?
Real-world use case as a Microsoft MVP
Wanted something pretty and pink
Because it was fun
© 2023 Cathrine Wilhelmsen (hi@cathrinew.net)
How did I get the data?
Cloudflare GraphQL API
One single endpoint for all API calls
Pass the GraphQL queries as a JSON object
© 2023 Cathrine Wilhelmsen (hi@cathrinew.net)
What did I do with the data?
Ingested data using Microsoft Fabric pipelines
Visualized the data using Power BI
Used the native app on my phone to view stats
© 2023 Cathrine Wilhelmsen (hi@cathrinew.net)
Let’s demo! 🤓
© 2023 Cathrine Wilhelmsen (hi@cathrinew.net)
What do I want to improve?
View country statistics
Rank content by popularity
Compare statistics across time periods
© 2023 Cathrine Wilhelmsen (hi@cathrinew.net)
Thank you! 💜
hi@cathrinew.net
@cathrinew
cathrinew.net

More Related Content

Similar to Website Analytics in my Pocket using Microsoft Fabric (AdaCon 2023) (20)

PDF
A Year of Data Science at Metail
Matt McDonnell
 
PDF
Mobile Enterprise Analytics in 60 Minutes
Cognizant
 
PDF
Analytics for Marketing
Jen Stirrup
 
PDF
Predictive Analytics PowerPoint Presentation Slides
SlideTeam
 
PDF
Big Data in Cloud: Seize your Insight Like a Golden Snitch (Margaret Ostapchu...
IT Arena
 
PDF
Predictive Analytics Powerpoint Presentation Slides
SlideTeam
 
PPTX
Big data
Abhishek Palo
 
PPTX
Big data
Abhishek Palo
 
PPTX
Microsoft graph (Insider Dev Tour)
Moaid Hathot
 
PDF
The 10 MS Rule: Getting to 'Yes' with Fast Data & Hadoop
VoltDB
 
PPTX
Data analytics - Let's break it down
Arpit Gupta
 
PDF
Data Wrangling and the Art of Big Data Discovery
Inside Analysis
 
PPT
Datapreneurs
suresh sood
 
PDF
Big Data Analytics Orientation. .pdf
080msdsa024yatru
 
PPTX
Power BI as a storyteller
Berkovich Consulting
 
PDF
Big Data Tools PowerPoint Presentation Slides
SlideTeam
 
PPTX
CaseStudy.pptx
XimenaBustamante14
 
PPTX
Webtrends and bright starr webinar 01282015 sharepoint is evolving
Kunaal Kapoor
 
PDF
uae views on big data
Aravindharamanan S
 
PPTX
big data analytics pgpmx2015
Sanmeet Dhokay
 
A Year of Data Science at Metail
Matt McDonnell
 
Mobile Enterprise Analytics in 60 Minutes
Cognizant
 
Analytics for Marketing
Jen Stirrup
 
Predictive Analytics PowerPoint Presentation Slides
SlideTeam
 
Big Data in Cloud: Seize your Insight Like a Golden Snitch (Margaret Ostapchu...
IT Arena
 
Predictive Analytics Powerpoint Presentation Slides
SlideTeam
 
Big data
Abhishek Palo
 
Big data
Abhishek Palo
 
Microsoft graph (Insider Dev Tour)
Moaid Hathot
 
The 10 MS Rule: Getting to 'Yes' with Fast Data & Hadoop
VoltDB
 
Data analytics - Let's break it down
Arpit Gupta
 
Data Wrangling and the Art of Big Data Discovery
Inside Analysis
 
Datapreneurs
suresh sood
 
Big Data Analytics Orientation. .pdf
080msdsa024yatru
 
Power BI as a storyteller
Berkovich Consulting
 
Big Data Tools PowerPoint Presentation Slides
SlideTeam
 
CaseStudy.pptx
XimenaBustamante14
 
Webtrends and bright starr webinar 01282015 sharepoint is evolving
Kunaal Kapoor
 
uae views on big data
Aravindharamanan S
 
big data analytics pgpmx2015
Sanmeet Dhokay
 

More from Cathrine Wilhelmsen (20)

PDF
Fra utvikler til arkitekt: Skap din egen karrierevei ved å utvikle din person...
Cathrine Wilhelmsen
 
PDF
Data Factory in Microsoft Fabric (MsBIP #82)
Cathrine Wilhelmsen
 
PDF
Getting Started: Data Factory in Microsoft Fabric (Microsoft Fabric Community...
Cathrine Wilhelmsen
 
PDF
Choosing Between Microsoft Fabric, Azure Synapse Analytics and Azure Data Fac...
Cathrine Wilhelmsen
 
PDF
Data Integration using Data Factory in Microsoft Fabric (ESPC Microsoft Fabri...
Cathrine Wilhelmsen
 
PDF
Choosing between Fabric, Synapse and Databricks (Data Left Unattended 2023)
Cathrine Wilhelmsen
 
PDF
Data Integration with Data Factory (Microsoft Fabric Day Oslo 2023)
Cathrine Wilhelmsen
 
PDF
The Battle of the Data Transformation Tools (PASS Data Community Summit 2023)
Cathrine Wilhelmsen
 
PDF
Visually Transform Data in Azure Data Factory or Azure Synapse Analytics (PAS...
Cathrine Wilhelmsen
 
PDF
Building an End-to-End Solution in Microsoft Fabric: From Dataverse to Power ...
Cathrine Wilhelmsen
 
PDF
Choosing Between Microsoft Fabric, Azure Synapse Analytics and Azure Data Fac...
Cathrine Wilhelmsen
 
PDF
Stressed, Depressed, or Burned Out? The Warning Signs You Shouldn't Ignore (D...
Cathrine Wilhelmsen
 
PDF
Stressed, Depressed, or Burned Out? The Warning Signs You Shouldn't Ignore (S...
Cathrine Wilhelmsen
 
PDF
"I can't keep up!" - Turning Discomfort into Personal Growth in a Fast-Paced ...
Cathrine Wilhelmsen
 
PDF
Lessons Learned: Implementing Azure Synapse Analytics in a Rapidly-Changing S...
Cathrine Wilhelmsen
 
PDF
6 Tips for Building Confidence as a Public Speaker (SQLBits 2022)
Cathrine Wilhelmsen
 
PDF
Lessons Learned: Understanding Pipeline Pricing in Azure Data Factory and Azu...
Cathrine Wilhelmsen
 
PDF
Pipelines and Data Flows: Introduction to Data Integration in Azure Synapse A...
Cathrine Wilhelmsen
 
PDF
Pipelines and Data Flows: Introduction to Data Integration in Azure Synapse A...
Cathrine Wilhelmsen
 
PDF
Understanding Azure Data Factory: The What, When, and Why (NIC 2020)
Cathrine Wilhelmsen
 
Fra utvikler til arkitekt: Skap din egen karrierevei ved å utvikle din person...
Cathrine Wilhelmsen
 
Data Factory in Microsoft Fabric (MsBIP #82)
Cathrine Wilhelmsen
 
Getting Started: Data Factory in Microsoft Fabric (Microsoft Fabric Community...
Cathrine Wilhelmsen
 
Choosing Between Microsoft Fabric, Azure Synapse Analytics and Azure Data Fac...
Cathrine Wilhelmsen
 
Data Integration using Data Factory in Microsoft Fabric (ESPC Microsoft Fabri...
Cathrine Wilhelmsen
 
Choosing between Fabric, Synapse and Databricks (Data Left Unattended 2023)
Cathrine Wilhelmsen
 
Data Integration with Data Factory (Microsoft Fabric Day Oslo 2023)
Cathrine Wilhelmsen
 
The Battle of the Data Transformation Tools (PASS Data Community Summit 2023)
Cathrine Wilhelmsen
 
Visually Transform Data in Azure Data Factory or Azure Synapse Analytics (PAS...
Cathrine Wilhelmsen
 
Building an End-to-End Solution in Microsoft Fabric: From Dataverse to Power ...
Cathrine Wilhelmsen
 
Choosing Between Microsoft Fabric, Azure Synapse Analytics and Azure Data Fac...
Cathrine Wilhelmsen
 
Stressed, Depressed, or Burned Out? The Warning Signs You Shouldn't Ignore (D...
Cathrine Wilhelmsen
 
Stressed, Depressed, or Burned Out? The Warning Signs You Shouldn't Ignore (S...
Cathrine Wilhelmsen
 
"I can't keep up!" - Turning Discomfort into Personal Growth in a Fast-Paced ...
Cathrine Wilhelmsen
 
Lessons Learned: Implementing Azure Synapse Analytics in a Rapidly-Changing S...
Cathrine Wilhelmsen
 
6 Tips for Building Confidence as a Public Speaker (SQLBits 2022)
Cathrine Wilhelmsen
 
Lessons Learned: Understanding Pipeline Pricing in Azure Data Factory and Azu...
Cathrine Wilhelmsen
 
Pipelines and Data Flows: Introduction to Data Integration in Azure Synapse A...
Cathrine Wilhelmsen
 
Pipelines and Data Flows: Introduction to Data Integration in Azure Synapse A...
Cathrine Wilhelmsen
 
Understanding Azure Data Factory: The What, When, and Why (NIC 2020)
Cathrine Wilhelmsen
 
Ad

Recently uploaded (20)

PPT
tuberculosiship-2106031cyyfuftufufufivifviviv
AkshaiRam
 
PDF
Context Engineering for AI Agents, approaches, memories.pdf
Tamanna
 
PPTX
apidays Singapore 2025 - From Data to Insights: Building AI-Powered Data APIs...
apidays
 
PDF
Avatar for apidays apidays PRO June 07, 2025 0 5 apidays Helsinki & North 2...
apidays
 
PPTX
apidays Helsinki & North 2025 - API access control strategies beyond JWT bear...
apidays
 
PPTX
SlideEgg_501298-Agentic AI.pptx agentic ai
530BYManoj
 
PDF
Simplifying Document Processing with Docling for AI Applications.pdf
Tamanna
 
PPTX
ER_Model_with_Diagrams_Presentation.pptx
dharaadhvaryu1992
 
PDF
Building Production-Ready AI Agents with LangGraph.pdf
Tamanna
 
PPTX
apidays Helsinki & North 2025 - Agentic AI: A Friend or Foe?, Merja Kajava (A...
apidays
 
PPTX
apidays Munich 2025 - Building Telco-Aware Apps with Open Gateway APIs, Subhr...
apidays
 
PPTX
Numbers of a nation: how we estimate population statistics | Accessible slides
Office for National Statistics
 
PPTX
AI Presentation Tool Pitch Deck Presentation.pptx
ShyamPanthavoor1
 
PDF
apidays Helsinki & North 2025 - REST in Peace? Hunting the Dominant Design fo...
apidays
 
PDF
apidays Helsinki & North 2025 - Monetizing AI APIs: The New API Economy, Alla...
apidays
 
PDF
OPPOTUS - Malaysias on Malaysia 1Q2025.pdf
Oppotus
 
PPTX
apidays Singapore 2025 - Designing for Change, Julie Schiller (Google)
apidays
 
PPTX
Aict presentation on dpplppp sjdhfh.pptx
vabaso5932
 
PPTX
apidays Helsinki & North 2025 - Vero APIs - Experiences of API development in...
apidays
 
PDF
What does good look like - CRAP Brighton 8 July 2025
Jan Kierzyk
 
tuberculosiship-2106031cyyfuftufufufivifviviv
AkshaiRam
 
Context Engineering for AI Agents, approaches, memories.pdf
Tamanna
 
apidays Singapore 2025 - From Data to Insights: Building AI-Powered Data APIs...
apidays
 
Avatar for apidays apidays PRO June 07, 2025 0 5 apidays Helsinki & North 2...
apidays
 
apidays Helsinki & North 2025 - API access control strategies beyond JWT bear...
apidays
 
SlideEgg_501298-Agentic AI.pptx agentic ai
530BYManoj
 
Simplifying Document Processing with Docling for AI Applications.pdf
Tamanna
 
ER_Model_with_Diagrams_Presentation.pptx
dharaadhvaryu1992
 
Building Production-Ready AI Agents with LangGraph.pdf
Tamanna
 
apidays Helsinki & North 2025 - Agentic AI: A Friend or Foe?, Merja Kajava (A...
apidays
 
apidays Munich 2025 - Building Telco-Aware Apps with Open Gateway APIs, Subhr...
apidays
 
Numbers of a nation: how we estimate population statistics | Accessible slides
Office for National Statistics
 
AI Presentation Tool Pitch Deck Presentation.pptx
ShyamPanthavoor1
 
apidays Helsinki & North 2025 - REST in Peace? Hunting the Dominant Design fo...
apidays
 
apidays Helsinki & North 2025 - Monetizing AI APIs: The New API Economy, Alla...
apidays
 
OPPOTUS - Malaysias on Malaysia 1Q2025.pdf
Oppotus
 
apidays Singapore 2025 - Designing for Change, Julie Schiller (Google)
apidays
 
Aict presentation on dpplppp sjdhfh.pptx
vabaso5932
 
apidays Helsinki & North 2025 - Vero APIs - Experiences of API development in...
apidays
 
What does good look like - CRAP Brighton 8 July 2025
Jan Kierzyk
 
Ad

Website Analytics in my Pocket using Microsoft Fabric (AdaCon 2023)

  • 2. © 2023 Cathrine Wilhelmsen ([email protected]) Website Analytics in My Pocket Using Microsoft Fabric Cathrine Wilhelmsen October 10th, 2023
  • 3. © 2023 Cathrine Wilhelmsen ([email protected]) Session Description As a technical blogger and event organizer, I'm always curious about my website traffic. How many visitors have I had? Where are they from? What days and times are my websites most popular? Which posts are read the most? All this information is available to me. There's only one gotcha: the data is only available for the past 30 days. That means if I want to compare how my website is doing next year compared to this year, I need to save the data somewhere else so it doesn't get lost - and build my own visualizations on top of it. Luckily for me, that's what I do for a living! In this session, I will show you how I've used Microsoft Fabric (the newest analytical service from Microsoft) to create my own pocket-sized dashboard for my website analytics. First, I will explain how I automatically collect the data from an API and store it in a central location. Then, I will show how I visualize the data in a mobile-friendly way using Power BI.
  • 4. © 2023 Cathrine Wilhelmsen ([email protected]) @cathrinew cathrinew.net
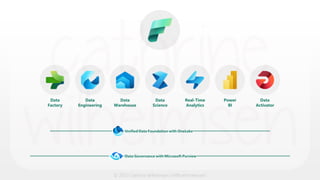
  • 5. © 2023 Cathrine Wilhelmsen ([email protected]) Data Factory Data Engineering Data Warehouse Data Science Real-Time Analytics Power BI Data Activator Unified Data Foundation with OneLake Data Governance with Microsoft Purview
  • 6. © 2023 Cathrine Wilhelmsen ([email protected]) What did I build? Cloudflare API Microsoft Fabric Daily Stats Hourly Stats Website Analytics
  • 7. © 2023 Cathrine Wilhelmsen ([email protected]) Why did I build it? Wanted to phase out Google Analytics Cloudflare offers free, privacy-first analytics Moved to Cloudflare in September 2023 Cloudflare only stores data for 30 days
  • 8. © 2023 Cathrine Wilhelmsen ([email protected]) Why did I build it this way? Real-world use case as a Microsoft MVP Wanted something pretty and pink Because it was fun
  • 9. © 2023 Cathrine Wilhelmsen ([email protected]) How did I get the data? Cloudflare GraphQL API One single endpoint for all API calls Pass the GraphQL queries as a JSON object
  • 10. © 2023 Cathrine Wilhelmsen ([email protected]) What did I do with the data? Ingested data using Microsoft Fabric pipelines Visualized the data using Power BI Used the native app on my phone to view stats
  • 11. © 2023 Cathrine Wilhelmsen ([email protected]) Let’s demo! 🤓
  • 12. © 2023 Cathrine Wilhelmsen ([email protected]) What do I want to improve? View country statistics Rank content by popularity Compare statistics across time periods
  • 13. © 2023 Cathrine Wilhelmsen ([email protected]) Thank you! 💜 [email protected] @cathrinew cathrinew.net