SlideShare a Scribd company logo
Credibility: Evaluating what’s Been Learned
Training and TestingWe measure the success of a classification procedure by using error rates (or equivalent success rates)Measuring success rate using training set is highly optimisticThe error rate on training set is called resubstitution errorWe have a separate test set for calculating success errorTest set should be independent of the training setAlso some time to improve our classification technique we use a validation setWhen we hold out some part of training set for testing (which is now not used for training), this process is called holdout procedure
Predicting performanceExpected success rate = 100 – error rate (If error rate is also in percentage)We want the true success rateCalculation of true success rateSuppose we have expected success rate(f) = s/n, where s is the number of success out of a total n instancesFor large value of n, f follows a normal distributionNow we will predict the true success rate (p) based on the  confidence percentage we want For example say our f = 75%, then p will lie in [73.2%,76.7%] with 80% confidence
Predicting performanceNow using properties of statistics we know that the mean of f is p and the variance is p(1-p)/nTo use normal distribution we will have to make the mean of f = 0 and standard deviation = 1 So suppose our confidence = c% and we want to calculate pWe will use the two tailed property of normal distributionAnd also that the are covered by normal distribution is taken as 100% so the are we will leave is 100 - c
Predicting performanceFinally after all the manipulations we have ,true success rate as:Here,                        p -> true success rate                        f - > expected success rate                        N -> Number of instances                         Z -> Factor derived from a normal distribution table using the  100-c measure
Cross validationWe use cross validation when amount of data is small and we need to have independent training and test set from itIt is important that each class is represented in its actual proportions in the training and test set: Stratification An important cross validation technique is stratified 10 fold cross validation, where the instance set is divided into 10 foldsWe have 10 iterations with taking a different single fold for testing and the rest 9 folds for training, averaging the error of the 10 iterationsProblem: Computationally intensive
Other estimatesLeave-one-out:StepsOne instance is left for testing and the rest are used for trainingThis is iterated for all the instances and the errors are averagedLeave-one-out:AdvantageWe use larger training setsLeave-one-out:DisadvantageComputationally intensiveCannot be stratified
Other estimates0.632 BootstrapDataset of n samples is sampled n times, with replacements, to give another dataset with n instancesThere will be some repeated instances in the second setHere error is defined as:e = 0.632x(error in test instances) + 0.368x(error in training instances)
Comparing data mining methodsTill now we were dealing with performance predictionNow we will look at methods to compare algorithms, to see which one did betterWe cant directly use Error rate to predict which algorithm is better as the error rate might have been calculated on different data setsSo to compare algorithms we need some statistical testsWe use Student’s  t- test to do this. This test help us to figure out if the mean error of two algorithm are different or not for a given confidence level
Comparing data mining methodsWe will use paired t-test which is a slight modification of student’s t-testPaired t-testSuppose we have unlimited data, do the following:Find k data sets from the unlimited data we haveUse cross validation with each technique to get the respective outcomes: x1, x2, x3,….,xk and y1,y2,y3,……,ykmx = mean of x values and similarly mydi = xi – yiUsing t-statistic:
Comparing data mining methodsBased on the value of k we get a degree of freedom, which enables us to figure out a z for a particular confidence valueIf  t <= (-z)   or  t >= (z) then, the two means differ significantly In case t = 0 then they don’t differ, we call this null hypothesis
Predicting ProbabilitiesTill now we were considering a scheme which when applied, results in either a correct or an incorrect prediction. This is called 0 – loss functionNow we will deal with the success incase of algorithms that outputs probability distribution for e.g. Naïve Bayes
Predicting ProbabilitiesQuadratic loss function:For a single instance there are k out comes or classesProbability vector: p1,p2,….,pkThe actual out come vector is: a1,a2,a3,…..ak (where the actual outcome will be 1, rest all 0)We have to minimize the quadratic loss function given by:The minimum will be achieved when the probability vector is the true probability vector
Predicting ProbabilitiesInformational loss function:Given by:–log(pi)Minimum is again reached at true probabilitiesDifferences between Quadratic loss and Informational lossWhile quadratic loss takes all probabilities under consideration, Informational loss is based only on the class probability While quadratic loss is bounded as its maximum output is 2, Informational loss is unbounded as it can output values up to infinity
Counting the costDifferent outcomes might have different costFor example in loan decision, the cost of lending to a defaulter is far greater that the lost-business cost of  refusing a loan to a non defaulterSuppose we have two class prediction. Outcomes can be:
Counting the costTrue positive rate: TP/(TP+FN)False positive rate: FP/(FP+TN)Overall success rate: Number of correct classification / Total Number of classificationError rate = 1 – success rateIn multiclass case we have a confusion matrix like (actual and a random one):
Counting the costThese are the actual and the random outcome of a three class problemThe diagonal represents the successful casesKappa statistic = (D-observed  -  D-actual) / (D-perfect  -  D-actual)Here kappa statistic = (140 – 82)/(200-82) = 49.2%Kappa is used to measure the agreement between predicted and observed categorizations of a dataset, while correcting for agreements that occurs by chanceDoes not take cost into account
Classification with costsExample Cost matrices (just gives us the number of errors):Success rate is measured by average cost per predictionWe try to minimize the costsExpected costs: dot products of vectors of class probabilities and appropriate column in cost matrix
Classification with costsSteps to take cost into consideration while testing:First use a learning method to get the probability vector (like Naïve Bayes) Now multiple the probability vector to each column of a cost matrix one by one so as to get the cost for each class/columnSelect the class with the minimum(or maximum!!) cost
Cost sensitive learningTill now we included the cost factor during evaluationWe will incorporate costs into the learning phase of a methodWe can change the ratio of instances in the training set so as to take care of costsFor example we can do replication of a instances of particular class so that our learning method will give us a model with less errors of that class
Lift ChartsIn practice, costs are rarely knownIn marketing terminology the response rate is referred to as the lift factorWe compare probable scenarios to make decisionsA lift chart allows visual comparisonExample: promotional mail out to 1,000,000 householdsMail to all: 0.1%response (1000)Some data mining tool identifies subset of 100, 000 of which 0.4% respond (400)A lift of 4
Lift ChartsSteps to calculate lift factor:We decide a sample sizeNow we arrange our data in decreasing order of the predicted probability of a class (the one which we will base our lift factor on: positive class)We calculate:Sample success proportion = Number of positive instances / Sample size Lift factor = Sample success proportion / Data success proportionWe calculate lift factor for different sample size to get  Lift Charts
Lift ChartsA hypothetical lift chart
Lift ChartsIn the lift chart we will like to stay towards the upper left cornerThe diagonal line is the curve for random samples without using sorted dataAny good selection will keep the lift curve above the diagonal
ROC CurvesStands for receiver operating characteristicDifference to lift charts:Y axis showspercentage of true positive X axis shows percentage of false positives in samplesROC is a jagged curveIt can be smoothened out by cross validation
ROC CurvesA ROC curve
ROC CurvesWays to generate cost curves(Consider the previous diagram for reference)First way:Get the probability distribution over different folds of dataSort the data in decreasing order of the probability of yes classSelect a point on X-axis and for that number of no, get the number of yes for each probability distributionAverage the number of yes from all the folds and plot it
ROC CurvesSecond way:Get the probability distribution over different folds of dataSort the data in decreasing order of the probability of yes classSelect a point on X-axis and for that number of no, get the number of yes for each probability distributionPlot a ROC for each fold individually Average all the ROCs
ROC CurvesROC curves for two schemes
ROC CurvesIn the previous ROC curves:For a small, focused sample, use method AFor a large one, use method BIn between, choose between A and B with appropriate probabilities
Recall – precision curvesIn case of a search query:Recall = number of documents retrieved that are relevant / total number of documents that are relevantPrecision = number of documents retrieved that are relevant / total number of documents that are retrieved
A summary         Different measures used to evaluate the false positive versus the false negative tradeoff
Cost curvesCost curves plot expected costs directlyExample for case with uniform costs (i.e. error):
Cost curvesExample with costs:
Cost curvesC[+|-]  is the cost of predicting + when the instance is –C[-|+]  is the cost of predicting - when the instance is +
Minimum Description Length PrincipleThe description length is defined as:Space required to describe a theory + space required to describe the theory’s mistakesTheory  = Classifier and mistakes = errors on the training dataWe try to minimize the description lengthMDL theory is the one that compresses the data the most. I.e to compress a data set we generate a model and then store the model and its mistakesWe need to compute:Size of the modelSpace needed to encode the error
Minimum Description Length PrincipleThe 2nd  one is easy. Just use informational loss functionFor  1st  we need a method to encode the modelL[T] = “length” of the theoryL[E|T] = training set encoded wrt the theory
Minimum Description Length PrincipleMDL and clusteringDescription length of theory: bits needed to encode the clusters. E.g. cluster centersDescription length of data given theory: encode cluster membership and position relative to cluster. E.g. distance to cluster centersWorks if coding scheme uses less code space for small numbers than for large ones
Visit more self help tutorialsPick a tutorial of your choice and browse through it at your own pace.The tutorials section is free, self-guiding and will not involve any additional support.Visit us at www.dataminingtools.net

More Related Content

What's hot (20)

DOCX
KHO DỮ LIỆU VÀ KHAI PHÁ DỮ LIỆU PTIT
Popping Khiem - Funky Dance Crew PTIT
 
PPT
Estimation
rishi.indian
 
PDF
Introduction to MCMC methods
Christian Robert
 
PDF
2.03 bayesian estimation
Andres Mendez-Vazquez
 
PDF
CÁC MOMENT VÀ PHÂN PHỐI CHUẨN
SoM
 
DOCX
Đồ án chương trình quản lý website du lịch
wem81315
 
DOC
Một số biện pháp nâng cao hiệu quả công tác hoạch định nguồn...
https://www.facebook.com/garmentspace
 
PDF
Classification metrics
SPb_Data_Science
 
PPTX
TRIANGULAR DISTRIBUTIONS
Cyriac Pius
 
PDF
Luận văn: Hỗ trợ hòa nhập cộng đồng đối với trẻ em mồ côi, HAY
Dịch vụ viết thuê Luận Văn - ZALO 0932091562
 
DOCX
Bìa báo cáo
Thế Anh Nguyễn
 
DOCX
PHÂN TÍCH CÁC YẾU TỐ ẢNH HƯỞNG ĐẾN LÒNG TRUNG THÀNH CỦA NHÂN VIÊN CÔNG TY TRÁ...
Tấn Quốc
 
PDF
Dbm630_Lecture02-03
Aj Kritsada Sriphaew
 
PPTX
Hypergeometric Distribution
mathscontent
 
PPTX
Real Applications of Normal Distributions
Long Beach City College
 
PPTX
Linear regression analysis
Nimrita Koul
 
PPTX
NLP-Text classification.pptx
Nguyễn Thái
 
PDF
BÀI GIẢNG NHẬP MÔN LẬP TRÌNH KHOA HỌC DỮ LIỆU
nataliej4
 
DOC
Luận văn: Giải quyết việc làm cho nông dân trong quá trình đô thị hoá
Dịch vụ viết thuê Luận Văn - ZALO 0932091562
 
PDF
Machine Learning for Survival Analysis
Chandan Reddy
 
KHO DỮ LIỆU VÀ KHAI PHÁ DỮ LIỆU PTIT
Popping Khiem - Funky Dance Crew PTIT
 
Estimation
rishi.indian
 
Introduction to MCMC methods
Christian Robert
 
2.03 bayesian estimation
Andres Mendez-Vazquez
 
CÁC MOMENT VÀ PHÂN PHỐI CHUẨN
SoM
 
Đồ án chương trình quản lý website du lịch
wem81315
 
Một số biện pháp nâng cao hiệu quả công tác hoạch định nguồn...
https://www.facebook.com/garmentspace
 
Classification metrics
SPb_Data_Science
 
TRIANGULAR DISTRIBUTIONS
Cyriac Pius
 
Luận văn: Hỗ trợ hòa nhập cộng đồng đối với trẻ em mồ côi, HAY
Dịch vụ viết thuê Luận Văn - ZALO 0932091562
 
Bìa báo cáo
Thế Anh Nguyễn
 
PHÂN TÍCH CÁC YẾU TỐ ẢNH HƯỞNG ĐẾN LÒNG TRUNG THÀNH CỦA NHÂN VIÊN CÔNG TY TRÁ...
Tấn Quốc
 
Dbm630_Lecture02-03
Aj Kritsada Sriphaew
 
Hypergeometric Distribution
mathscontent
 
Real Applications of Normal Distributions
Long Beach City College
 
Linear regression analysis
Nimrita Koul
 
NLP-Text classification.pptx
Nguyễn Thái
 
BÀI GIẢNG NHẬP MÔN LẬP TRÌNH KHOA HỌC DỮ LIỆU
nataliej4
 
Luận văn: Giải quyết việc làm cho nông dân trong quá trình đô thị hoá
Dịch vụ viết thuê Luận Văn - ZALO 0932091562
 
Machine Learning for Survival Analysis
Chandan Reddy
 

Viewers also liked (20)

PPTX
WEKA: Practical Machine Learning Tools And Techniques
DataminingTools Inc
 
PPTX
WEKA: Introduction To Weka
DataminingTools Inc
 
PPTX
R Statistics
DataminingTools Inc
 
PPTX
LISP: Declarations In Lisp
DataminingTools Inc
 
PPTX
MS Sql Server: Doing Calculations With Functions
DataminingTools Inc
 
PDF
Cinnamonhotel saigon 2013_01
cinnamonhotel
 
XLSX
Test
spencer shanks
 
PPTX
Data Applied:Forecast
DataminingTools Inc
 
PPT
Facebook: An Innovative Influenza Pandemic Early Warning System
Chen Luo
 
PPTX
Control Statements in Matlab
DataminingTools Inc
 
PPTX
Introduction to Data-Applied
DataminingTools Inc
 
PPTX
Matlab Text Files
DataminingTools Inc
 
PPT
Mphone
msprincess915
 
PPTX
Clickthrough
dpapageorge
 
KEY
Kidical Mass Presentation
Eugene SRTS
 
PPTX
RapidMiner: Setting Up A Process
DataminingTools Inc
 
PPTX
Data Applied:Tree Maps
DataminingTools Inc
 
PPT
Wisconsin Fertility Institute: Injection Class 2011
WisFertility
 
PPTX
SPSS: File Managment
DataminingTools Inc
 
PPTX
LISP:Object System Lisp
DataminingTools Inc
 
WEKA: Practical Machine Learning Tools And Techniques
DataminingTools Inc
 
WEKA: Introduction To Weka
DataminingTools Inc
 
R Statistics
DataminingTools Inc
 
LISP: Declarations In Lisp
DataminingTools Inc
 
MS Sql Server: Doing Calculations With Functions
DataminingTools Inc
 
Cinnamonhotel saigon 2013_01
cinnamonhotel
 
Data Applied:Forecast
DataminingTools Inc
 
Facebook: An Innovative Influenza Pandemic Early Warning System
Chen Luo
 
Control Statements in Matlab
DataminingTools Inc
 
Introduction to Data-Applied
DataminingTools Inc
 
Matlab Text Files
DataminingTools Inc
 
Clickthrough
dpapageorge
 
Kidical Mass Presentation
Eugene SRTS
 
RapidMiner: Setting Up A Process
DataminingTools Inc
 
Data Applied:Tree Maps
DataminingTools Inc
 
Wisconsin Fertility Institute: Injection Class 2011
WisFertility
 
SPSS: File Managment
DataminingTools Inc
 
LISP:Object System Lisp
DataminingTools Inc
 
Ad

Similar to WEKA: Credibility Evaluating Whats Been Learned (20)

PPT
BIIntroduction. on business intelligenceppt
ShivaniSharma335055
 
PPT
Business Intelligence and Data Analytics.ppt
sarangahmed4
 
PPT
BIIntro.ppt
PerumalPitchandi
 
PPT
clustering, k-mean clustering, confusion matrices
SteffinAlex
 
PPTX
Think-Aloud Protocols
butest
 
PDF
13ClassifierPerformance.pdf
ssuserdce5c21
 
PDF
Assessing Model Performance - Beginner's Guide
Megan Verbakel
 
PPTX
module_of_healthcare_wound_healing_mbbs_3.pptx
harshypate56l8155
 
PPTX
Predictive analytics using 'R' Programming
ssusere796b3
 
PPTX
Statistical Learning and Model Selection module 2.pptx
nagarajan740445
 
PPTX
Module 3_ Classification.pptx
nikshaikh786
 
PPTX
datamining-lect11.pptx
RithikRaj25
 
PDF
lec21.pdf
RISHABHJAIN27097
 
PDF
Bridging the Gap: Machine Learning for Ubiquitous Computing -- Evaluation
Thomas Ploetz
 
PPT
MLlectureMethod.ppt
butest
 
PPT
MLlectureMethod.ppt
butest
 
PPT
isabelle_webinar_jan..
butest
 
PPT
5_Model for Predictions_Machine_Learning.ppt
VGaneshKarthikeyan
 
BIIntroduction. on business intelligenceppt
ShivaniSharma335055
 
Business Intelligence and Data Analytics.ppt
sarangahmed4
 
BIIntro.ppt
PerumalPitchandi
 
clustering, k-mean clustering, confusion matrices
SteffinAlex
 
Think-Aloud Protocols
butest
 
13ClassifierPerformance.pdf
ssuserdce5c21
 
Assessing Model Performance - Beginner's Guide
Megan Verbakel
 
module_of_healthcare_wound_healing_mbbs_3.pptx
harshypate56l8155
 
Predictive analytics using 'R' Programming
ssusere796b3
 
Statistical Learning and Model Selection module 2.pptx
nagarajan740445
 
Module 3_ Classification.pptx
nikshaikh786
 
datamining-lect11.pptx
RithikRaj25
 
lec21.pdf
RISHABHJAIN27097
 
Bridging the Gap: Machine Learning for Ubiquitous Computing -- Evaluation
Thomas Ploetz
 
MLlectureMethod.ppt
butest
 
MLlectureMethod.ppt
butest
 
isabelle_webinar_jan..
butest
 
5_Model for Predictions_Machine_Learning.ppt
VGaneshKarthikeyan
 
Ad

More from DataminingTools Inc (20)

PPTX
Terminology Machine Learning
DataminingTools Inc
 
PPTX
Techniques Machine Learning
DataminingTools Inc
 
PPTX
Machine learning Introduction
DataminingTools Inc
 
PPTX
Areas of machine leanring
DataminingTools Inc
 
PPTX
AI: Planning and AI
DataminingTools Inc
 
PPTX
AI: Logic in AI 2
DataminingTools Inc
 
PPTX
AI: Logic in AI
DataminingTools Inc
 
PPTX
AI: Learning in AI 2
DataminingTools Inc
 
PPTX
AI: Learning in AI
DataminingTools Inc
 
PPTX
AI: Introduction to artificial intelligence
DataminingTools Inc
 
PPTX
AI: Belief Networks
DataminingTools Inc
 
PPTX
AI: AI & Searching
DataminingTools Inc
 
PPTX
AI: AI & Problem Solving
DataminingTools Inc
 
PPTX
Data Mining: Text and web mining
DataminingTools Inc
 
PPTX
Data Mining: Outlier analysis
DataminingTools Inc
 
PPTX
Data Mining: Mining stream time series and sequence data
DataminingTools Inc
 
PPTX
Data Mining: Mining ,associations, and correlations
DataminingTools Inc
 
PPTX
Data Mining: Graph mining and social network analysis
DataminingTools Inc
 
PPTX
Data warehouse and olap technology
DataminingTools Inc
 
PPTX
Data Mining: Data processing
DataminingTools Inc
 
Terminology Machine Learning
DataminingTools Inc
 
Techniques Machine Learning
DataminingTools Inc
 
Machine learning Introduction
DataminingTools Inc
 
Areas of machine leanring
DataminingTools Inc
 
AI: Planning and AI
DataminingTools Inc
 
AI: Logic in AI 2
DataminingTools Inc
 
AI: Logic in AI
DataminingTools Inc
 
AI: Learning in AI 2
DataminingTools Inc
 
AI: Learning in AI
DataminingTools Inc
 
AI: Introduction to artificial intelligence
DataminingTools Inc
 
AI: Belief Networks
DataminingTools Inc
 
AI: AI & Searching
DataminingTools Inc
 
AI: AI & Problem Solving
DataminingTools Inc
 
Data Mining: Text and web mining
DataminingTools Inc
 
Data Mining: Outlier analysis
DataminingTools Inc
 
Data Mining: Mining stream time series and sequence data
DataminingTools Inc
 
Data Mining: Mining ,associations, and correlations
DataminingTools Inc
 
Data Mining: Graph mining and social network analysis
DataminingTools Inc
 
Data warehouse and olap technology
DataminingTools Inc
 
Data Mining: Data processing
DataminingTools Inc
 

Recently uploaded (20)

PDF
OFFOFFBOX™ – A New Era for African Film | Startup Presentation
ambaicciwalkerbrian
 
PDF
Build with AI and GDG Cloud Bydgoszcz- ADK .pdf
jaroslawgajewski1
 
PDF
Economic Impact of Data Centres to the Malaysian Economy
flintglobalapac
 
PPTX
Applied-Statistics-Mastering-Data-Driven-Decisions.pptx
parmaryashparmaryash
 
PDF
Market Insight : ETH Dominance Returns
CIFDAQ
 
PDF
Presentation about Hardware and Software in Computer
snehamodhawadiya
 
PDF
Tea4chat - another LLM Project by Kerem Atam
a0m0rajab1
 
PDF
A Strategic Analysis of the MVNO Wave in Emerging Markets.pdf
IPLOOK Networks
 
PPTX
Agile Chennai 18-19 July 2025 | Emerging patterns in Agentic AI by Bharani Su...
AgileNetwork
 
PPTX
AI in Daily Life: How Artificial Intelligence Helps Us Every Day
vanshrpatil7
 
PDF
Make GenAI investments go further with the Dell AI Factory
Principled Technologies
 
PDF
Data_Analytics_vs_Data_Science_vs_BI_by_CA_Suvidha_Chaplot.pdf
CA Suvidha Chaplot
 
PPTX
Simple and concise overview about Quantum computing..pptx
mughal641
 
PDF
Trying to figure out MCP by actually building an app from scratch with open s...
Julien SIMON
 
PPTX
The Future of AI & Machine Learning.pptx
pritsen4700
 
PDF
MASTERDECK GRAPHSUMMIT SYDNEY (Public).pdf
Neo4j
 
PDF
The Future of Artificial Intelligence (AI)
Mukul
 
PPTX
AVL ( audio, visuals or led ), technology.
Rajeshwri Panchal
 
PDF
CIFDAQ's Market Wrap : Bears Back in Control?
CIFDAQ
 
PDF
Per Axbom: The spectacular lies of maps
Nexer Digital
 
OFFOFFBOX™ – A New Era for African Film | Startup Presentation
ambaicciwalkerbrian
 
Build with AI and GDG Cloud Bydgoszcz- ADK .pdf
jaroslawgajewski1
 
Economic Impact of Data Centres to the Malaysian Economy
flintglobalapac
 
Applied-Statistics-Mastering-Data-Driven-Decisions.pptx
parmaryashparmaryash
 
Market Insight : ETH Dominance Returns
CIFDAQ
 
Presentation about Hardware and Software in Computer
snehamodhawadiya
 
Tea4chat - another LLM Project by Kerem Atam
a0m0rajab1
 
A Strategic Analysis of the MVNO Wave in Emerging Markets.pdf
IPLOOK Networks
 
Agile Chennai 18-19 July 2025 | Emerging patterns in Agentic AI by Bharani Su...
AgileNetwork
 
AI in Daily Life: How Artificial Intelligence Helps Us Every Day
vanshrpatil7
 
Make GenAI investments go further with the Dell AI Factory
Principled Technologies
 
Data_Analytics_vs_Data_Science_vs_BI_by_CA_Suvidha_Chaplot.pdf
CA Suvidha Chaplot
 
Simple and concise overview about Quantum computing..pptx
mughal641
 
Trying to figure out MCP by actually building an app from scratch with open s...
Julien SIMON
 
The Future of AI & Machine Learning.pptx
pritsen4700
 
MASTERDECK GRAPHSUMMIT SYDNEY (Public).pdf
Neo4j
 
The Future of Artificial Intelligence (AI)
Mukul
 
AVL ( audio, visuals or led ), technology.
Rajeshwri Panchal
 
CIFDAQ's Market Wrap : Bears Back in Control?
CIFDAQ
 
Per Axbom: The spectacular lies of maps
Nexer Digital
 

WEKA: Credibility Evaluating Whats Been Learned

  • 2. Training and TestingWe measure the success of a classification procedure by using error rates (or equivalent success rates)Measuring success rate using training set is highly optimisticThe error rate on training set is called resubstitution errorWe have a separate test set for calculating success errorTest set should be independent of the training setAlso some time to improve our classification technique we use a validation setWhen we hold out some part of training set for testing (which is now not used for training), this process is called holdout procedure
  • 3. Predicting performanceExpected success rate = 100 – error rate (If error rate is also in percentage)We want the true success rateCalculation of true success rateSuppose we have expected success rate(f) = s/n, where s is the number of success out of a total n instancesFor large value of n, f follows a normal distributionNow we will predict the true success rate (p) based on the confidence percentage we want For example say our f = 75%, then p will lie in [73.2%,76.7%] with 80% confidence
  • 4. Predicting performanceNow using properties of statistics we know that the mean of f is p and the variance is p(1-p)/nTo use normal distribution we will have to make the mean of f = 0 and standard deviation = 1 So suppose our confidence = c% and we want to calculate pWe will use the two tailed property of normal distributionAnd also that the are covered by normal distribution is taken as 100% so the are we will leave is 100 - c
  • 5. Predicting performanceFinally after all the manipulations we have ,true success rate as:Here, p -> true success rate f - > expected success rate N -> Number of instances Z -> Factor derived from a normal distribution table using the 100-c measure
  • 6. Cross validationWe use cross validation when amount of data is small and we need to have independent training and test set from itIt is important that each class is represented in its actual proportions in the training and test set: Stratification An important cross validation technique is stratified 10 fold cross validation, where the instance set is divided into 10 foldsWe have 10 iterations with taking a different single fold for testing and the rest 9 folds for training, averaging the error of the 10 iterationsProblem: Computationally intensive
  • 7. Other estimatesLeave-one-out:StepsOne instance is left for testing and the rest are used for trainingThis is iterated for all the instances and the errors are averagedLeave-one-out:AdvantageWe use larger training setsLeave-one-out:DisadvantageComputationally intensiveCannot be stratified
  • 8. Other estimates0.632 BootstrapDataset of n samples is sampled n times, with replacements, to give another dataset with n instancesThere will be some repeated instances in the second setHere error is defined as:e = 0.632x(error in test instances) + 0.368x(error in training instances)
  • 9. Comparing data mining methodsTill now we were dealing with performance predictionNow we will look at methods to compare algorithms, to see which one did betterWe cant directly use Error rate to predict which algorithm is better as the error rate might have been calculated on different data setsSo to compare algorithms we need some statistical testsWe use Student’s t- test to do this. This test help us to figure out if the mean error of two algorithm are different or not for a given confidence level
  • 10. Comparing data mining methodsWe will use paired t-test which is a slight modification of student’s t-testPaired t-testSuppose we have unlimited data, do the following:Find k data sets from the unlimited data we haveUse cross validation with each technique to get the respective outcomes: x1, x2, x3,….,xk and y1,y2,y3,……,ykmx = mean of x values and similarly mydi = xi – yiUsing t-statistic:
  • 11. Comparing data mining methodsBased on the value of k we get a degree of freedom, which enables us to figure out a z for a particular confidence valueIf t <= (-z) or t >= (z) then, the two means differ significantly In case t = 0 then they don’t differ, we call this null hypothesis
  • 12. Predicting ProbabilitiesTill now we were considering a scheme which when applied, results in either a correct or an incorrect prediction. This is called 0 – loss functionNow we will deal with the success incase of algorithms that outputs probability distribution for e.g. Naïve Bayes
  • 13. Predicting ProbabilitiesQuadratic loss function:For a single instance there are k out comes or classesProbability vector: p1,p2,….,pkThe actual out come vector is: a1,a2,a3,…..ak (where the actual outcome will be 1, rest all 0)We have to minimize the quadratic loss function given by:The minimum will be achieved when the probability vector is the true probability vector
  • 14. Predicting ProbabilitiesInformational loss function:Given by:–log(pi)Minimum is again reached at true probabilitiesDifferences between Quadratic loss and Informational lossWhile quadratic loss takes all probabilities under consideration, Informational loss is based only on the class probability While quadratic loss is bounded as its maximum output is 2, Informational loss is unbounded as it can output values up to infinity
  • 15. Counting the costDifferent outcomes might have different costFor example in loan decision, the cost of lending to a defaulter is far greater that the lost-business cost of refusing a loan to a non defaulterSuppose we have two class prediction. Outcomes can be:
  • 16. Counting the costTrue positive rate: TP/(TP+FN)False positive rate: FP/(FP+TN)Overall success rate: Number of correct classification / Total Number of classificationError rate = 1 – success rateIn multiclass case we have a confusion matrix like (actual and a random one):
  • 17. Counting the costThese are the actual and the random outcome of a three class problemThe diagonal represents the successful casesKappa statistic = (D-observed - D-actual) / (D-perfect - D-actual)Here kappa statistic = (140 – 82)/(200-82) = 49.2%Kappa is used to measure the agreement between predicted and observed categorizations of a dataset, while correcting for agreements that occurs by chanceDoes not take cost into account
  • 18. Classification with costsExample Cost matrices (just gives us the number of errors):Success rate is measured by average cost per predictionWe try to minimize the costsExpected costs: dot products of vectors of class probabilities and appropriate column in cost matrix
  • 19. Classification with costsSteps to take cost into consideration while testing:First use a learning method to get the probability vector (like Naïve Bayes) Now multiple the probability vector to each column of a cost matrix one by one so as to get the cost for each class/columnSelect the class with the minimum(or maximum!!) cost
  • 20. Cost sensitive learningTill now we included the cost factor during evaluationWe will incorporate costs into the learning phase of a methodWe can change the ratio of instances in the training set so as to take care of costsFor example we can do replication of a instances of particular class so that our learning method will give us a model with less errors of that class
  • 21. Lift ChartsIn practice, costs are rarely knownIn marketing terminology the response rate is referred to as the lift factorWe compare probable scenarios to make decisionsA lift chart allows visual comparisonExample: promotional mail out to 1,000,000 householdsMail to all: 0.1%response (1000)Some data mining tool identifies subset of 100, 000 of which 0.4% respond (400)A lift of 4
  • 22. Lift ChartsSteps to calculate lift factor:We decide a sample sizeNow we arrange our data in decreasing order of the predicted probability of a class (the one which we will base our lift factor on: positive class)We calculate:Sample success proportion = Number of positive instances / Sample size Lift factor = Sample success proportion / Data success proportionWe calculate lift factor for different sample size to get Lift Charts
  • 24. Lift ChartsIn the lift chart we will like to stay towards the upper left cornerThe diagonal line is the curve for random samples without using sorted dataAny good selection will keep the lift curve above the diagonal
  • 25. ROC CurvesStands for receiver operating characteristicDifference to lift charts:Y axis showspercentage of true positive X axis shows percentage of false positives in samplesROC is a jagged curveIt can be smoothened out by cross validation
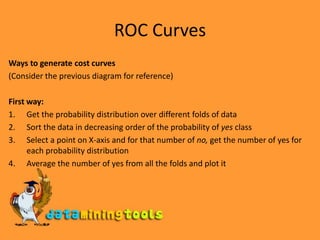
  • 27. ROC CurvesWays to generate cost curves(Consider the previous diagram for reference)First way:Get the probability distribution over different folds of dataSort the data in decreasing order of the probability of yes classSelect a point on X-axis and for that number of no, get the number of yes for each probability distributionAverage the number of yes from all the folds and plot it
  • 28. ROC CurvesSecond way:Get the probability distribution over different folds of dataSort the data in decreasing order of the probability of yes classSelect a point on X-axis and for that number of no, get the number of yes for each probability distributionPlot a ROC for each fold individually Average all the ROCs
  • 29. ROC CurvesROC curves for two schemes
  • 30. ROC CurvesIn the previous ROC curves:For a small, focused sample, use method AFor a large one, use method BIn between, choose between A and B with appropriate probabilities
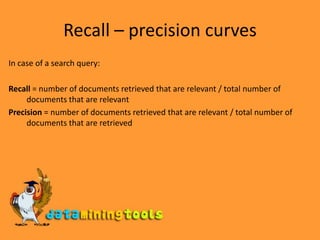
  • 31. Recall – precision curvesIn case of a search query:Recall = number of documents retrieved that are relevant / total number of documents that are relevantPrecision = number of documents retrieved that are relevant / total number of documents that are retrieved
  • 32. A summary Different measures used to evaluate the false positive versus the false negative tradeoff
  • 33. Cost curvesCost curves plot expected costs directlyExample for case with uniform costs (i.e. error):
  • 35. Cost curvesC[+|-] is the cost of predicting + when the instance is –C[-|+] is the cost of predicting - when the instance is +
  • 36. Minimum Description Length PrincipleThe description length is defined as:Space required to describe a theory + space required to describe the theory’s mistakesTheory = Classifier and mistakes = errors on the training dataWe try to minimize the description lengthMDL theory is the one that compresses the data the most. I.e to compress a data set we generate a model and then store the model and its mistakesWe need to compute:Size of the modelSpace needed to encode the error
  • 37. Minimum Description Length PrincipleThe 2nd one is easy. Just use informational loss functionFor 1st we need a method to encode the modelL[T] = “length” of the theoryL[E|T] = training set encoded wrt the theory
  • 38. Minimum Description Length PrincipleMDL and clusteringDescription length of theory: bits needed to encode the clusters. E.g. cluster centersDescription length of data given theory: encode cluster membership and position relative to cluster. E.g. distance to cluster centersWorks if coding scheme uses less code space for small numbers than for large ones
  • 39. Visit more self help tutorialsPick a tutorial of your choice and browse through it at your own pace.The tutorials section is free, self-guiding and will not involve any additional support.Visit us at www.dataminingtools.net