What is the State of my Kafka Streams Application? Unleashing Metrics. | Neil Buesing, Object Partners
0 likes1,543 views

The document discusses improving the monitoring of Kafka Streams applications through metrics analysis and dashboard creation. Key takeaways include methods to extract metrics via JMX tooling, building visualization dashboards, and validating data controls. It also highlights the significance of end-to-end metrics and how to optimize performance through partitioning and resource metrics.


![Time Series Database
• Prometheus
remove port from
URL for dashboard
- job_name: targets
file_sd_configs:
- files:
- /etc/prometheus/targets.json
relabel_configs:
- source_labels: [__address__]
regex: '(.*):(.*)'
target_label: instance
replacement: '$1'](https://image.slidesharecdn.com/neilbuesingfinalfmp-210610162430/85/What-is-the-State-of-my-Kafka-Streams-Application-Unleashing-Metrics-Neil-Buesing-Object-Partners-12-320.jpg)


![Containerized Druid and configuration
part of GitHub project
Druid
{
"type": "kafka",
"spec": {
"ioConfig": {...},
"dataSchema": {
"dataSource": "_metrics-kafka-streams",
"granularitySpec": {
"type": "uniform",
"queryGranularity": "fifteen_minute",
"segmentGranularity": "fifteen_minute",
"rollup": true
},
"timestampSpec": {
"column": "timestamp",
"format": "millis"
},
"dimensionsSpec": {
"dimensions": [
<<COLUMNS>>
]
},
"metricsSpec": [
{
"name": "count",
"type": "count"
},
{
"name": "value",
"type": "doubleLast",
"fieldName": "value"
}
]
}
}
}](https://image.slidesharecdn.com/neilbuesingfinalfmp-210610162430/85/What-is-the-State-of-my-Kafka-Streams-Application-Unleashing-Metrics-Neil-Buesing-Object-Partners-39-320.jpg)


What is the State of my Kafka Streams Application? Unleashing Metrics. | Neil Buesing, Object Partners
- 1. What is the State of my Kafka Streams Application? Unleashing Metrics. Neil Buesing Kafka Summit Europe 2021 @nbuesing nbuesing
- 2. Takeaways 1. See how to extract metrics from your application using existing JMX tooling. 2. Walkthrough how to build a dashboard for observing those metrics. 3. Explore options of how to add additional JMX resources and Kafka Stream metrics to your application. 4. How to verify you built your dashboard correctly by creating a data control set to validate the dashboards. 5. How to go beyond what you can collect from the Kafka Stream metrics. 6. An analysis and overview of the provided metrics, including the new end-to-end metrics of Kafka Streams 2.7.
- 3. So Many Metrics • Kafka Broker • JVM • Kafka Client • Producer • Consumer • Kafka Streams
- 4. Kafka Stream Metrics • Kafka Clients • Producer • Consumer • Admin • Restore Consumer • Client Thread Task Processor State Store • Processing • Thread • Task (sub-topology) • Processor Node • Persistence Metrics • State Store • RocksDB • Record Cache
- 5. JVM Thread JVM Kafka Stream Metrics Thread Task Processor State Store • Job (Application) • Instance (JVM) • Thread (Worker) • Task (sub-topology) • Partition • State Stores Task Processor State Store Thread Task Processor State Store desire evenly distribution when scaling? consider 12 or 24 partitions 12 -> 1/2/3/4/6/12 24 -> 1/2/3/4/6/8/12/24
- 6. Let's Build A Dashboard https://pixy.org/4796106/
- 7. What's Needed • Access to the Metrics • Time Series Database • Visualization https://pixabay.com/images/id-309118/
- 8. Getting the Metrics • MetricsReporter • Built-in JMXReporter • RMI - JConsole (UI), jmxterm (CLI) • Java Agents - JMX Exporter (Prometheus), Jolokia • Frameworks • 3rd Party Metric Reporters • Write Your Own JMX is the reason for the warning when using . and _ in topic names. As . gets converted to _ in JMX.
- 9. Prometheus JMX Exporter streams-config.yml • Give Me Everything lowercaseOutputName: true rules: - pattern: (.*)<type=(.*)><>(.*) • http://{hostname}:7071 -javaagent:/jmx_prometheus_javaagent.jar=7071:/streams-config.yml"
- 10. Prometheus JMX Exporter streams-config.yml • Give Me Just What I Want lowercaseOutputName: true rules: - pattern: java.lang<type=(.*)> - pattern: kafka.streams<type=stream-thread-metrics, thread-id=(.+), task-id=(.+)><>(.*) - pattern: kafka.streams<type=stream-task-metrics, thread-id=(.+)><>(.*) - pattern: kafka.consumer.*<client-id=(.+)><>(.*) - pattern: kafka.producer.*<client-id=(.+)><>(.*) time curl -s http://localhost:7071 | wc -l 2244 | 0.179 total time time curl -s http://localhost:7071 | wc -l 4243 | 0.490 total time
- 11. Prometheus JMX Exporter streams-config.yml • Give Me Just What I Want It And the Way I Want It lowercaseOutputName: true rules: - pattern: kafka.streams<type=stream-record-cache-metrics, thread-id=(.+), task-id=(.+)_(.+), record-cache-id=(.+)><>(.+):.+ name: kafka_streams_stream_record_cache_metrics labels: thread_id: "$1" task_id: "$2" partition_id: "$3" record-cache-id: "$4" metric: "$5" See streams-config.yml in streams/docker/streams-config.yml for complete example
- 12. Time Series Database • Prometheus remove port from URL for dashboard - job_name: targets file_sd_configs: - files: - /etc/prometheus/targets.json relabel_configs: - source_labels: [__address__] regex: '(.*):(.*)' target_label: instance replacement: '$1'
- 13. Dashboard
- 14. Variables
- 15. Dashboard • ~5 / second? • what's wrong? • Grafana computed?
- 16. • Name the topology processes KSTREAM-PEEK-0000000027 • Client property client.id and thread_id • utilize JMX Prometheus • grafana autocomplete • =~ • Breakdown Graph & Total Let's Build A Dashboard: Takeaways
- 17. Baseline Application Application State • Users - KTable • Store - Global KTable • Products - KTable • Assembly (Purchase Order) - Aggregate orders-purchase orders-pickup repartition attach user & store attach line item pricing assemble
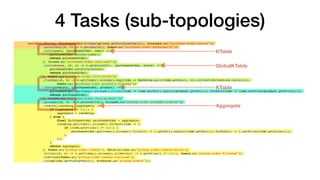
- 18. 4 Tasks (sub-topologies) builder.<String, PurchaseOrder>stream(options.getPurchaseTopic(), Consumed.as("purchase-order-source")) .selectKey((k, v) -> v.getUserId(), Named.as("purchase-order-keyByUserId")) .join(users, (purchaseOrder, user) -> { purchaseOrder.setUser(user); return purchaseOrder; }, Joined.as("purchase-order-join-user")) .join(stores, (k, v) -> v.getStoreId(), (purchaseOrder, store) -> { purchaseOrder.setStore(store); return purchaseOrder; }, Named.as("purchase-order-join-store")) .flatMap((k, v) -> v.getItems().stream().map(item -> KeyValue.pair(item.getSku(), v)).collect(Collectors.toList()), Named.as("purchase-order-products-flatmap")) .join(products, (purchaseOrder, product) -> { purchaseOrder.getItems().stream().filter(item -> item.getSku().equals(product.getSku())).forEach(item -> item.setPrice(product.getPrice())); return purchaseOrder; }, Joined.as("purchase-order-join-product")) .groupBy((k, v) -> v.getOrderId(), Grouped.as("pickup-order-groupBy-orderId")) .reduce((incoming, aggregate) -> { if (aggregate == null) { aggregate = incoming; } else { final PurchaseOrder purchaseOrder = aggregate; incoming.getItems().stream().forEach(item -> { if (item.getPrice() != null) { purchaseOrder.getItems().stream().filter(i -> i.getSku().equals(item.getSku())).forEach(i -> i.setPrice(item.getPrice())); } }); } return aggregate; }, Named.as("pickup-order-reduce"), Materialized.as("pickup-order-reduce-store")) .filter((k, v) -> v.getItems().stream().allMatch(i -> i.getPrice() != null), Named.as("pickup-order-filtered")) .toStream(Named.as("pickup-order-reduce-tostream")) .to(options.getPickupTopic(), Produced.as("pickup-orders")); KTable GlobalKTable KTable Aggregate
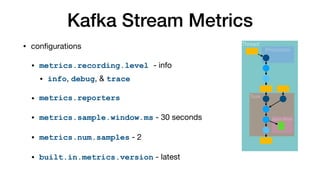
- 19. Kafka Stream Metrics • configurations • metrics.recording.level - info • info, debug, & trace • metrics.reporters • metrics.sample.window.ms - 30 seconds • metrics.num.samples - 2 • built.in.metrics.version - latest Thread Task Processor State Store
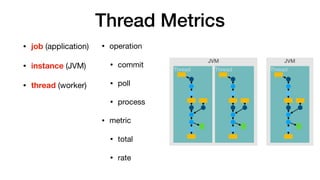
- 20. Thread Metrics • operation • commit • poll • process • metric • total • rate • job (application) • instance (JVM) • thread (worker) JVM JVM Thread Thread Thread
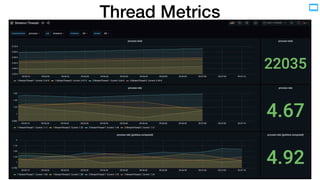
- 21. Thread Metrics
- 22. Task Metrics • operation • commit • process • metric • total • rate • job (application) • instance (JVM) • thread (worker) • task • subtopology • partition JVM JVM Thread Thread Task Task Thread Task Task Task Task
- 23. Task Metrics
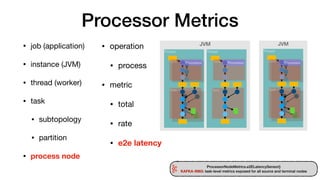
- 24. Processor Metrics • operation • process • metric • total • rate • e2e latency • job (application) • instance (JVM) • thread (worker) • task • subtopology • partition • process node JVM JVM Thread Thread Task Task Thread Task Task Task Task Processor Processor Processor ProcessorNodeMetrics.e2ELatencySensor() KAFKA-9983: task-level metrics exposed for all source and terminal nodes
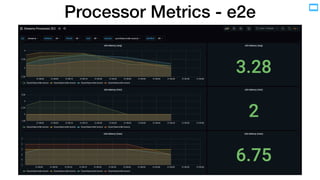
- 26. Processor Metrics - e2e
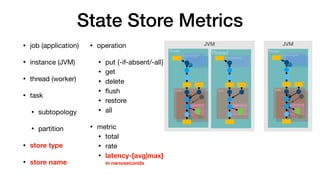
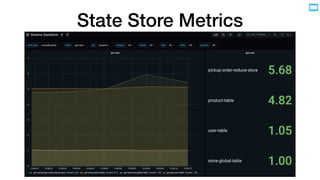
- 27. State Store Metrics JVM Thread JVM Thread Task Processor State Store Processor Task State Store Thread Task Processor State Store • operation • put {-if-absent/-all} • get • delete • flush • restore • all • metric • total • rate • latency-{avg|max} in nanoseconds • job (application) • instance (JVM) • thread (worker) • task • subtopology • partition • store type • store name
- 29. Additional RocksDB Metrics num-immutable-mem-table cur-size-active-mem-table cur-size-all-mem-tables size-all-mem-tables num-entries-active-mem-table num-entries-imm-mem-tables num-deletes-active-mem-table num-deletes-imm-mem-tables mem-table-flush-pending num-running-flushes compaction-pending num-running-compactions estimate-pending-compaction-bytes bytes-written-rate bytes-read-rate memtable-bytes-flushed-rate memtable-hit-ratio block-cache-data-hit-ratio block-cache-index-hit-ratio block-cache-filter-hit-ratio write-stall-duration-avg write-stall-duration-total bytes-read-compaction-rate number-open-files number-file-errors-total Property Metrics Statistical Metrics total-sst-files-size live-sst-files-size num-live-versions block-cache-capacity block-cache-usage block-cache-pinned-usage estimate-num-keys estimate-table-readers-mem background-errors
- 30. Record Cache Metrics JVM Thread JVM Thread Task Processor State Store Processor Task State Store Thread Task Processor State Store • metric • hit-ratio-min • hit-ratio-max • hit-ratio-avg • job (application) • instance (JVM) • thread (worker) • task • subtopology • partition • store name
- 32. Explore The Metrics • 1 Application (Job) • 2 Instances (JVMs) • 2 Threads/Instance • 4 Partitions - even distribution orders-purchase orders-pickup repartition attach user & store attach line item pricing assemble • 10 orders/second & 3 line-items/order • Scenarios • network-issues for 1 instance • 100ms delay to brokers • processing issue • 100ms pricing delay Traffic Control tc linux command
- 33. 100ms network latency 'stream'
- 34. 100ms pricing processing No Issues Pricing (#4) 100ms delay
- 35. Explore The Metrics: Takeaways • Understand how Operations will use the Dashboards • Baseline / Control Application • Chaos Monkey
- 36. Alternate Collection Example • Access to the Metrics • Custom Metric • Custom Reporter • Time Series Database • Apache Druid • Visualization • Druid SQL Query
- 37. Custom Metric .transformValues(() -> new ValueTransformerWithKey<String, PurchaseOrder, PurchaseOrder>() { private Sensor sensor; public void init(ProcessorContext context) { sensor = createSensor(Thread.currentThread().getName(), context.taskId().toString(), "purchase-order-lineitem-counter", (StreamsMetricsImpl) context.metrics()); } public PurchaseOrder transform(String readOnlyKey, PurchaseOrder value) { sensor.record(value.getItems().size()); return value; } public Sensor createSensor(final String threadId, final String taskId, final String processorNodeId, final StreamsMetricsImpl sm) { return sm(threadId, taskId, processorNodeId, processorNodeId + "-lineitems", Sensor.RecordingLevel.INFO); addAvgAndMinAndMaxToSensor(sensor, PROCESSOR_NODE_LEVEL_GROUP, sm.nodeLevelTagMap(threadId, taskId, processorNodeId), "lineitems", "avg-doc","min-doc","max-doc"); return sensor; } } StreamsMetricsImpl
- 38. Custom Reporter private ObjectNode jsonNode(final KafkaMetric metric) { ObjectNode objectNode = JsonNodeFactory.instance.objectNode(); ... // populate objectNode with immutable data from metric return objectNode; } public void run() { map.forEach((k, v) -> { final KafkaMetric metric = v.getKey(); final ObjectNode node = v.getValue(); node.put("value", v.getKey().value()); node.put("timestamp", System.currentTimeMillis()); producer.send( new ProducerRecord<>(topic, metric.metricName().name(), serialize(node))); }); } @Override public void init(final List<KafkaMetric> metrics) { metrics.forEach(metric -> { map.put(metric.metricName(), Pair.of(metric, jsonNode(metric))); }); executor.scheduleAtFixedRate(runnable, 5L, 5L, TimeUnit.SECONDS); } @Override public void metricChange(final KafkaMetric metric) { map.put(metric.metricName(), Pair.of(metric, jsonNode(metric))); } @Override public void metricRemoval(KafkaMetric metric) { map.remove(metric.metricName()); } @Override public void close() { this.executor.shutdownNow(); } If reporter uses a Kafka producer, be sure to config.remove("metric.reporters")
- 39. Containerized Druid and configuration part of GitHub project Druid { "type": "kafka", "spec": { "ioConfig": {...}, "dataSchema": { "dataSource": "_metrics-kafka-streams", "granularitySpec": { "type": "uniform", "queryGranularity": "fifteen_minute", "segmentGranularity": "fifteen_minute", "rollup": true }, "timestampSpec": { "column": "timestamp", "format": "millis" }, "dimensionsSpec": { "dimensions": [ <<COLUMNS>> ] }, "metricsSpec": [ { "name": "count", "type": "count" }, { "name": "value", "type": "doubleLast", "fieldName": "value" } ] } } }
- 40. Takeaways • 2.5 - Metric Overhaul (KIP-444) • 2.7 - Added e2e Latency (KIP-613) • "Discovery" Dashboards • Validate • `-total` metrics great for validation • Extensible
- 41. Thank you https://github.com/nbuesing/kafka-streams-dashboards (docker and Java11 required) ./scripts/startup.sh @nbuesing nbuesing