Infographics
Produced by European Parliamentary Research Service animated infographics are visual and interactive guides, updated regularly, to help you find the information you need on a complex issue.

This website provides key facts and figures about the European Parliament and its Members (MEPs), both for the current parliamentary term and for all previous terms since direct elections were introduced in 1979. You can select data going back as far as 1979, at three given points in each parliamentary term (the beginning, the middle and the end of each legislature).

The European Union has created a ground-breaking instrument, Next Generation EU (NGEU), to counter the crisis triggered by the coronavirus pandemic and help its Member States make their economies and societies more sustainable, digital and inclusive. This interactive infographic tracks how Member States are doing in the design and implementation of their recovery and resilience plans financed by NGEU.
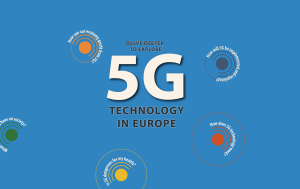
The introduction of 5G technology will have considerable impact on a wide range of aspects of our lives. Explore what we know about the technology with our visual mapping – covering 5G's political and regulatory context, the likely effects on business, health concerns and cybersecurity, as well as the details of the technology itself. From a broad overview, zoom in to access greater detail, including interviews with experts and explanatory graphics.

The JTF aims at supporting coal regions and those with the highest industrial greenhouse gas emission intensity to face the challenges of transition to achieving climate neutrality by 2050 and to cut emissions by at least 50 % by 2030. This infographic provides detailed information on allocated funding and illustrates the allocation method used to distribute EU funds to all Member States.